Infographics for the Week of January 4th: The New Year

Happy New Year!

To help our students and us usher in 2016, this week’s infographics are all about this new year.

Statistics on New Year’s Eve in NYC:

New-Years-Eve-2016-BB-Inforgraphic-

These are New Year’s Resolutions from around the world:

new-years-resolutions-2016

And these are New Years Resolutions that include SMART goals for our Resolutions . . . just like our SGOs . . .

new_years_info


Infographics on Infographics for the Week of 12/7/15

This week’s infographics are all about . . . well, infographics.  These are great resources if you’re looking for students to create original infographics in lieu of notes, as a study guide, or as a product of their research.  These can also begin discussions about purpose and audience and the decisions writers must make to reach the audience for their desired purpose.

Included are:  “The Anatomy of a Great Infographic,” “An Infographic about Infographics,” “7 Tips to Create an Awesome Infographic” “Why Infographics,” and “Why You Need Infographics.”

If you want students to create their own, check out piktochart.com and sign up for free!


anatomy of an infographicinfographic about infographicstips for creating an infographicwhy infographicswhy you need infographics

Infographics for the Week of October 26th: Halloween Around the World, Costumes by State, and Top Costumes for 2015

These infographics about Halloween are great for analysis of visual text (RI.9-12.7) and especially author’s choice in regard to structure.  Since it’s visual, it’s easier to talk about structure.  So if your students are struggling with CCSS Reading standard 5, infographics may be a great way to enter the conversation.

These can also be a great opportunity to get students prepared to develop and answer inquiry questions for research papers and/or performance assessments.  Since this is the compiled research, they can work backwards to determine the possible research question and then assess how well the creator/author of the infographic answered that question.  This kind of analysis could then be turned into a checklist-of-sorts of how you sufficiently respond to a research question.

These infographics could also be great for practice with inference, with formulating questions, etc.

So, some specific ways for students to interact (individually, in pairs, small groups, etc.) with these infographics might include:

  • What accounts for the differences and similarities among countries in “Halloween around the world”? (inference practice)
  • What do the traditions in different countries reveal about them? (inference practice)
  • What conclusions might we draw based on the top costumes by state in “America’s Favorite Halloween Costumes by State”? What research or inquiry questions could we develop about these states based on the costume? (great opportunity to practice writing these types of questions and perhaps engage students in researching to find the answers) (inference practice, W.9-12.7 if they conduct the research; developing the question is good practice for getting them to meet this standard on their own as well.)
  • How does pop culture help determine what people wear on Halloween? What other factors may influence this? (“Top Costumes”)
  • What research or inquiry question is each infographic seeking to answer? (RI.9-12.2, RI.9-12.7, W.9-12.7)
  • How does the author organize/structure his/her information? Is it effective – why or why not? (RI.9-12.2, RI.9-12.5, RI.9-12-.1)
  • What is the connection/relationship to the information provided ____________ and that provided __________? (RI.9-12.3)
  • Analyze and evaluate: Which of these infographics is the most useful? the most effective? the most dynamic?  (Support with specific textual evidence – RI.9-12.1)

And of course, if these are discussions with specific expectations/roles/teacher modeling – students would likely be hitting speaking & listening standards as well, particularly SL.9-12.1a-d.

halloween around the world

halloween costumes by state

SPIRIT HALLOWEEN SHOWS OFF THE HOTTEST LOOKS & COSTUME TRENDS FOR 'HALLOWEEKEND' 2015 (PRNewsFoto/Spirit Halloween)

SPIRIT HALLOWEEN SHOWS OFF THE HOTTEST LOOKS & COSTUME TRENDS FOR ‘HALLOWEEKEND’ 2015 (PRNewsFoto/Spirit Halloween)

Infographics of the Week for October 19-23: The History & Benefits of Social Media

“Infographics of the Week” is back!  The subject for next week’s cluster is all about social media as a way to reach customers and about the evolution and trends in social media.  With the constant barrage of the negative aspects of social media, these infographics could begin a conversation about social media that is broader than usual.

Infographics are fun and valuable ways to work with students in hitting CCSS.  They can easily be used for:

  • analysis practice (how ideas/claims are developed = RI.9-10.5, effectiveness of structure = RI.11-12.5)),
  • in-depth compare/contrast (what information is included in and excluded from each and why?, evaluation of sources, how sources address a question  – RI.9-10.7, RI.11-12.7)
  • evaluation of the credibility/reliability of sources – (W.9-12.8 – “assess the usefulness of each source”)
  • as a way to gather information on a question or topic (W.9-12.9)
  • models for organizing and designing their own research-based infographics (such an assignment would include W.9-12.4 [“development, organization, and style appropriate to task, purpose, and audience”], W.9-12.6 [“Use technology to produce, publish, and update individual or shared writing products, taking advantage of technology’s capacity to link to other information and to display information flexibly and dynamically.”], W.9-12.7 (“Conduct short as well as more sustained research projects to answer a question or solve a problem . . . synthesize multiple sources on the subject . . . demonstrate an understanding of the subject.)
  • Socratic Seminar texts and writing prompts
    2015-BusinessWire-MediaLeaders-PR-Social-Media-Infographic-700x700 a8445b4fa7241590c02e76782b31e313 history-social-media-2004-2014 social-media-trends-infographic social-media-users-02-2015-2

The Visual Syllabus

It’s that time of year and I couldn’t be more excited for all that’s to come!

As we prepare for a new school year, one of the things we’re often doing is modifying or updating our class syllabus and expectations.  And often, despite our best efforts, these tend to have more blocks of text than we’d like, and our students stare at it and us blankly when we review it in the beginning of the school year.

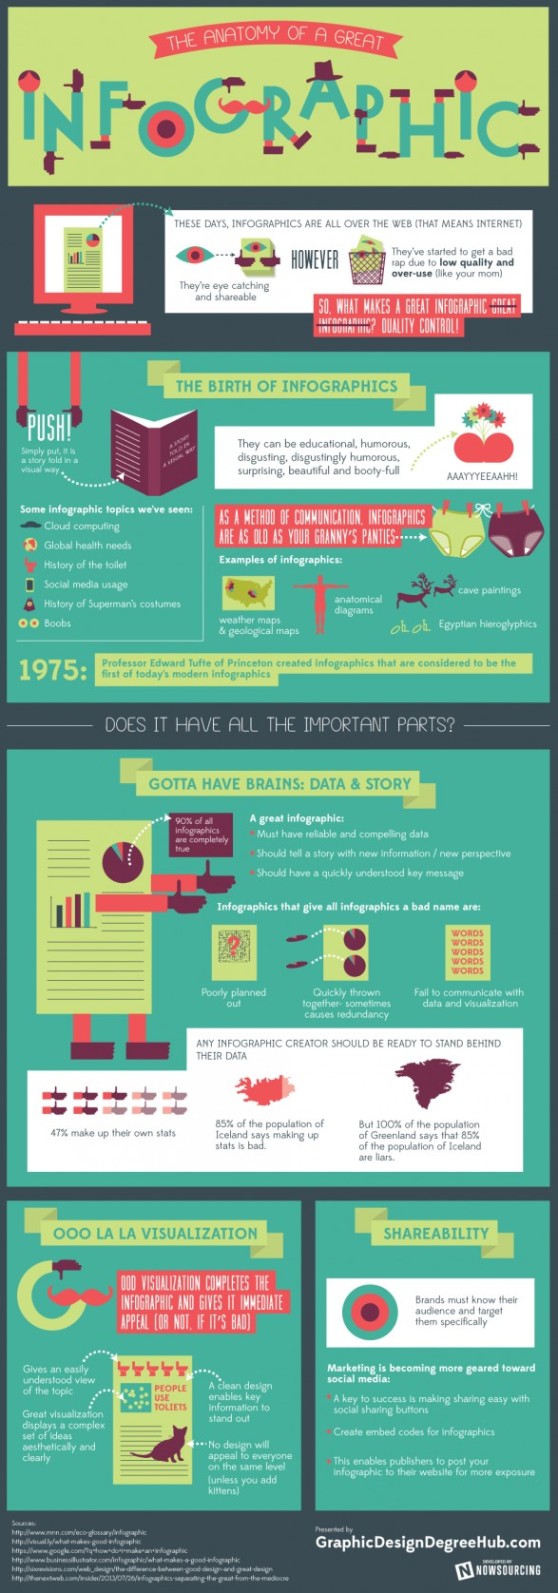
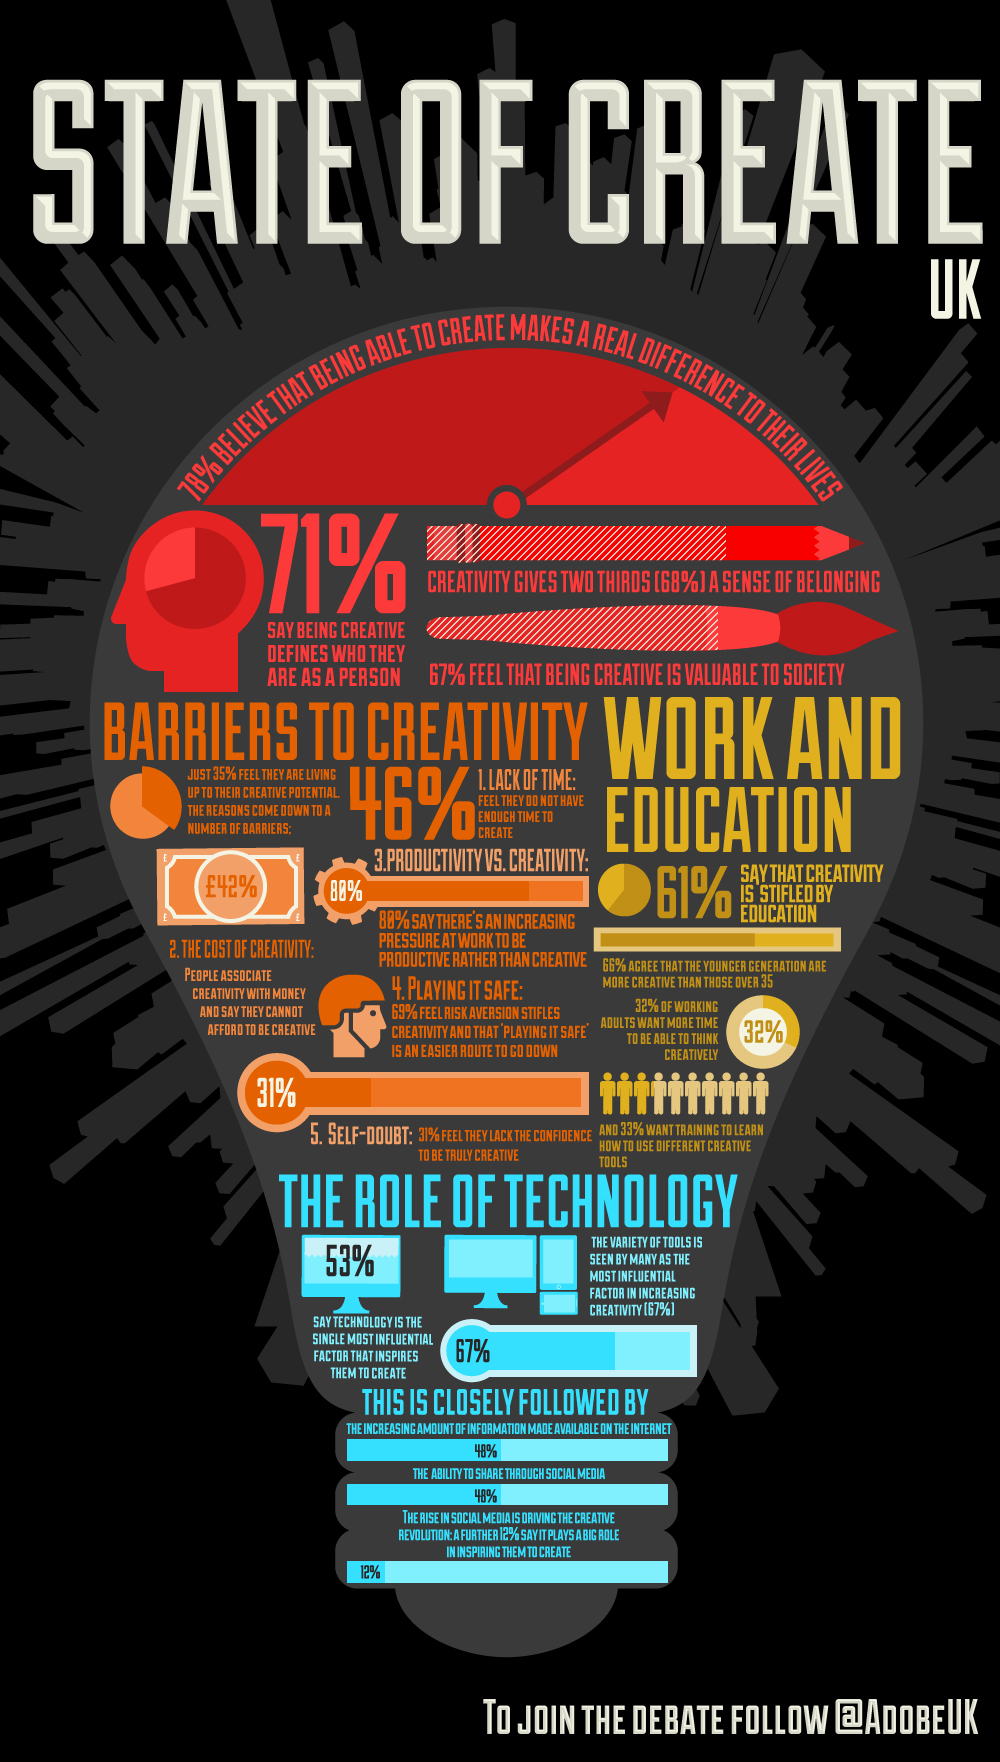
Enter the “Visual Syllabus” or what I like to call the Syllabus-Gone-Infographic.  Infographics are effective ways of presenting information largely because of their layout and visual-quality.  Bottom-line, students might find themselves reading over it simply because it looks cooler or easier to read.  Plus, you can put a QR code on it that will link them to your website.

A New Classroom Poster?

AND if you have a really rad syllabus, who’s to say you can’t use your school’s poster printer to make a large laminated copy to display in your classroom?

A Few Examples:

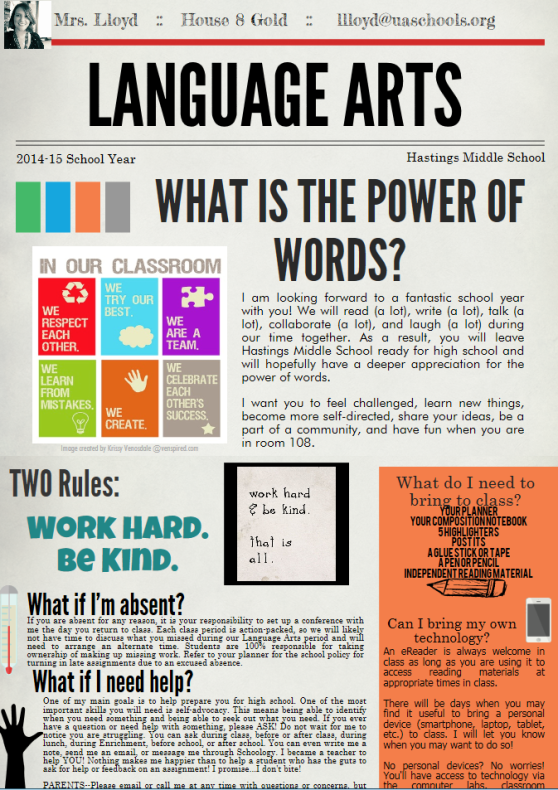
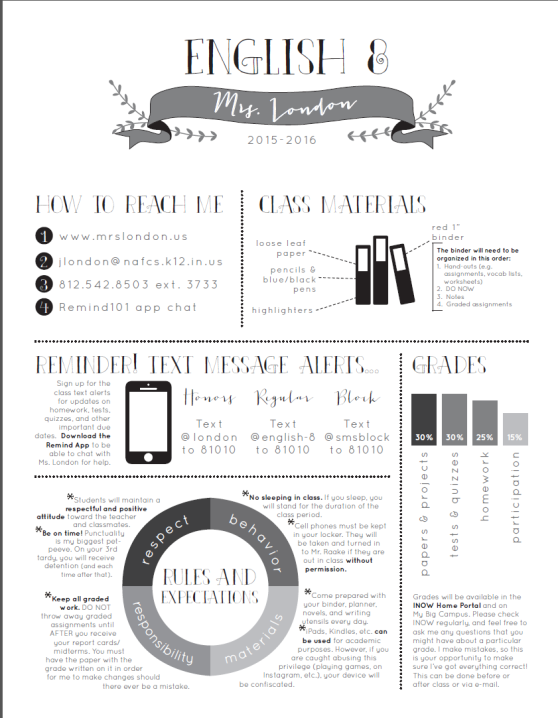
So here are a few examples of teachers’ visual syllabi.

Many of these were created using piktochart, a free site to make infographics (that also has a PRO Version discounted for Educators) 

visual syllabus 1

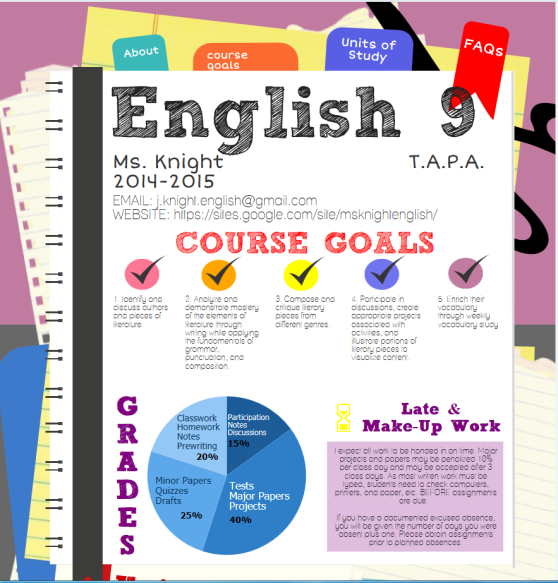
To see this full infographic, click hereenglish 9, version 2 | Piktochart Infographic Editor.

visual syllabus 2

To see this full infographic, click here: 2014-15 Syllabus | Piktochart Infographic Editor.

visual syllabus 3

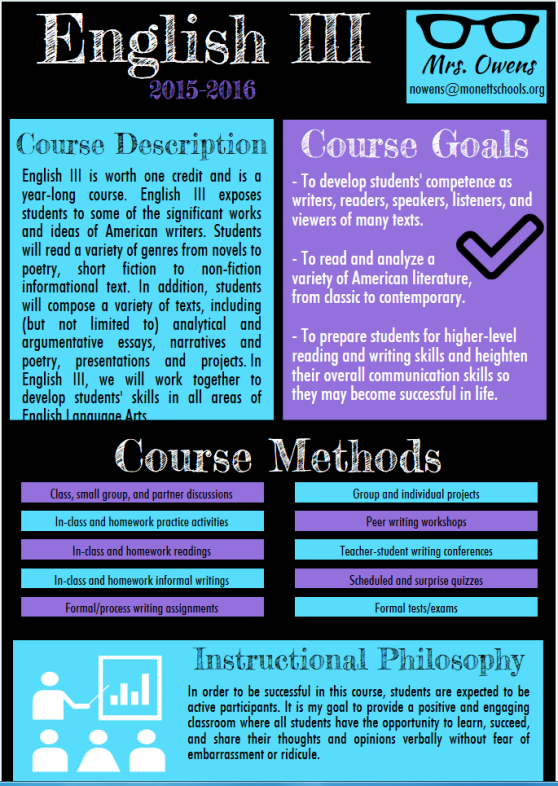
To see this full infographic, click here: English III Syllabus | Piktochart Infographic Editor.

visual syllabus 4

To see this full infographic, click here.

visual syllabus 5

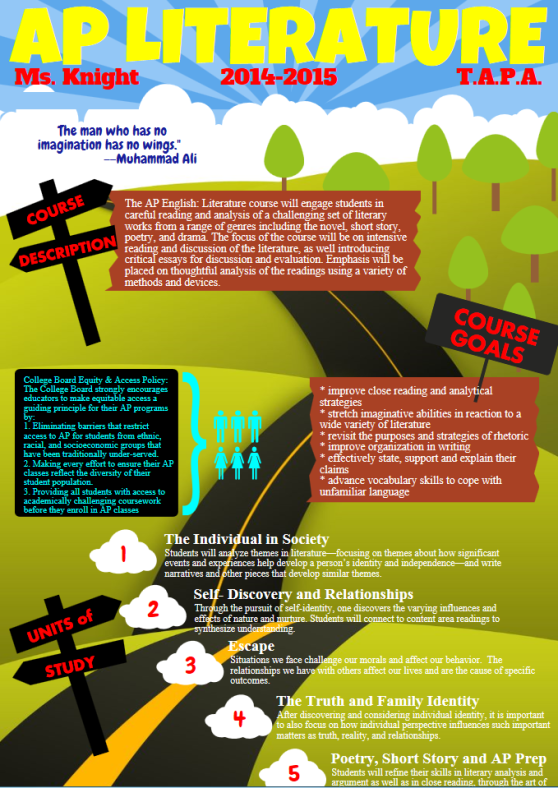
To see this full infographic, click here: AP Literature | Piktochart Infographic Editor.