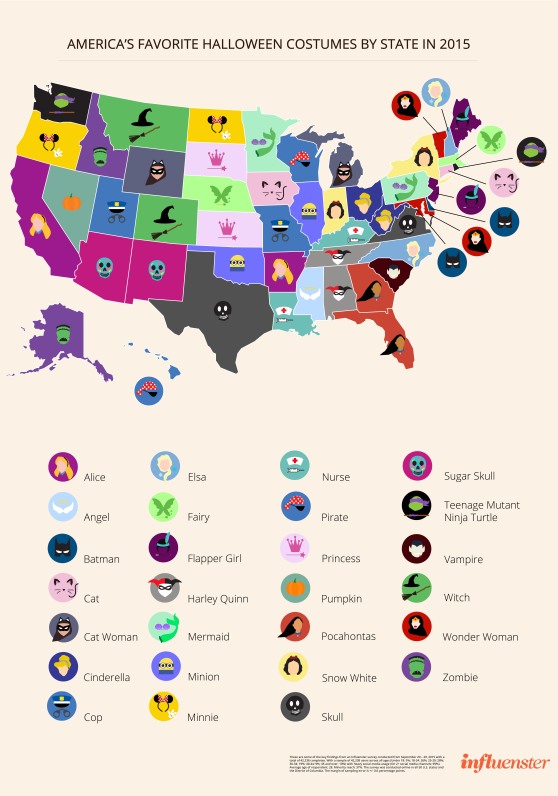
These infographics about Halloween are great for analysis of visual text (RI.9-12.7) and especially author’s choice in regard to structure. Since it’s visual, it’s easier to talk about structure. So if your students are struggling with CCSS Reading standard 5, infographics may be a great way to enter the conversation.
These can also be a great opportunity to get students prepared to develop and answer inquiry questions for research papers and/or performance assessments. Since this is the compiled research, they can work backwards to determine the possible research question and then assess how well the creator/author of the infographic answered that question. This kind of analysis could then be turned into a checklist-of-sorts of how you sufficiently respond to a research question.
These infographics could also be great for practice with inference, with formulating questions, etc.
So, some specific ways for students to interact (individually, in pairs, small groups, etc.) with these infographics might include:
- What accounts for the differences and similarities among countries in “Halloween around the world”? (inference practice)
- What do the traditions in different countries reveal about them? (inference practice)
- What conclusions might we draw based on the top costumes by state in “America’s Favorite Halloween Costumes by State”? What research or inquiry questions could we develop about these states based on the costume? (great opportunity to practice writing these types of questions and perhaps engage students in researching to find the answers) (inference practice, W.9-12.7 if they conduct the research; developing the question is good practice for getting them to meet this standard on their own as well.)
- How does pop culture help determine what people wear on Halloween? What other factors may influence this? (“Top Costumes”)
- What research or inquiry question is each infographic seeking to answer? (RI.9-12.2, RI.9-12.7, W.9-12.7)
- How does the author organize/structure his/her information? Is it effective – why or why not? (RI.9-12.2, RI.9-12.5, RI.9-12-.1)
- What is the connection/relationship to the information provided ____________ and that provided __________? (RI.9-12.3)
- Analyze and evaluate: Which of these infographics is the most useful? the most effective? the most dynamic? (Support with specific textual evidence – RI.9-12.1)
And of course, if these are discussions with specific expectations/roles/teacher modeling – students would likely be hitting speaking & listening standards as well, particularly SL.9-12.1a-d.


